The Raritan Blog
Home » Raritan Blog
Raritan's DCIM Wins NetworkWorld Product Excellence Award 2013
Paula Alves
January 10, 2014
Cisco Saves Millions by Deploying Thousands of Smart PDUs
Michael Bord
December 26, 2013

Imagine being able to save your company millions of dollars per year by investing in a low-cost, easy-to-install solution that’s simple to adopt and fits right into your existing infrastructure. If it sounds dumb, or perhaps too good to be true, take note—Cisco has just done it.
4 Ways Intelligent PDUs Can Help you Save Money
Nina Kvitka
December 20, 2013

1. Use metering to help you identify “ghost servers.” A SUN survey estimates 8 to 10% of servers are “ghost” servers (servers running idle). Using an intelligent metered PDU, such as one of Raritan’s PX models can help you identify these servers. Exorcise ghost servers and save real money.
2. While you’re at it, use the same data to help identify older, less efficient servers. Replacing older servers with new, energy-efficient models reduces server power consumption by 25%.
3. Set up some smart sensors with your intelligent PDU to learn where you’re overcooling your data center. PX environmental sensors monitor temperature and alert you when user-defined high (too warm) and low (excessively cool) thresholds are exceeded. Use the ASHRAE defined standards and safely raise temperatures, saving energy and money on excessive cooling.
4. Make your capacity planning and provisioning decisions with real-time data. Intelligent PDUs gather the data to make your data center’s true power capacity visible.
Experiment with the Raritan Power Management ROI Calculator to see how the savings can add up for your data center.
What’s One Leading Cause of Data Center Downtime? It’s You.
Michael Bord
December 18, 2013
“To err is human, to purr is feline.” – Robert Bryne
One look at Switch’s SuperNap data centers is all it will take to convince you of the importance of color-coding within your own data center. Switch has assembled the world’s largest data center campus, serving the enterprise needs of over 500 clients, from startups to Fortune 1000s from its secure 2.2. Million square foot campus in Las Vegas, Nevada.
With so many clients around the world relying on Switch to securely host their business services and provide near real-time results, the company can scarcely afford for any of its millions of servers to experience downtime due to power outages. But, this begs the question, how might one reduce or eliminate power outages altogether?
Recent data center industry reports suggest that an overwhelming number of data center power outages are attributable to human error caused by mislabeling PDU racks, or being unable to identify problem areas. It’s a finding that underpins the need for a solution like color PDUs and cables that can help data center staff to avoid outages due to careless mistakes.
Need proof? Visit Switch’s SuperNap data center gallery to see how Raritan’s Color PDUs and SecureLock™ cables are being used in a live data center environment. And, download a copy of Raritan’s 5 Great Reasons to Use Colored Rack PDUs to safeguard your data center from outages that could inadvertently be caused by you.
Data Center Airside Economizers and Humidity
Greg More
December 10, 2013
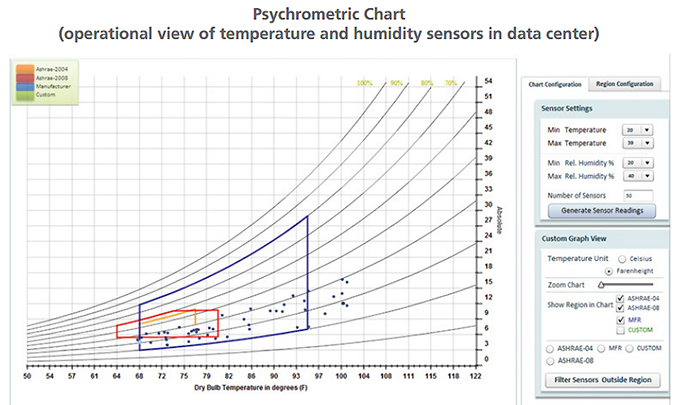
The American Society of Heating, Refrigeration and Air-Conditioning Engineers (ASHRAE) publishes recommended ranges for temperature (65 degrees to 80 degrees F, 18 degrees to 27 degrees C) and relative humidity (20% to 80%).
One of the best ways to understand the relationship between temperature and humidity is to look at a psychrometric chart. The bottom of the chart is dry bulb temperature meaning air containing no moisture. The scale on the right of the chart is the amount of moisture in pounds contained in a pound of dry air. The curves running through the chart are the relative humidity (RH) from 0% to 100%. The temperature scale along the 100% RH curve is the wet bulb temperature.
Subscribe
Upcoming Events
Latest Raritan News
- Legrand Wins Back-to-Back Awards for Intelligent Rack Power Distribution Innovation
- Posted on May 24, 2024
- Legrand Certifications and Process Controls Provide Confidence in Information Security for Network-Connected Devices in Data-Related Applications
- Posted on April 1, 2024
- Legrand Releases Version 4.0 of Raritan’s Industry-Leading Secure KVM Switches, Raising Bar for Secure Desktop Access
- Posted on July 31, 2023
- Legrand Revitalizes Data Center Sector with Two Revolutionary Intelligent Rack PDUs
- Posted on May 1, 2023
- Raritan Reveals The MasterConsole® Digital Dual KVM Switch
- Posted on February 18, 2021